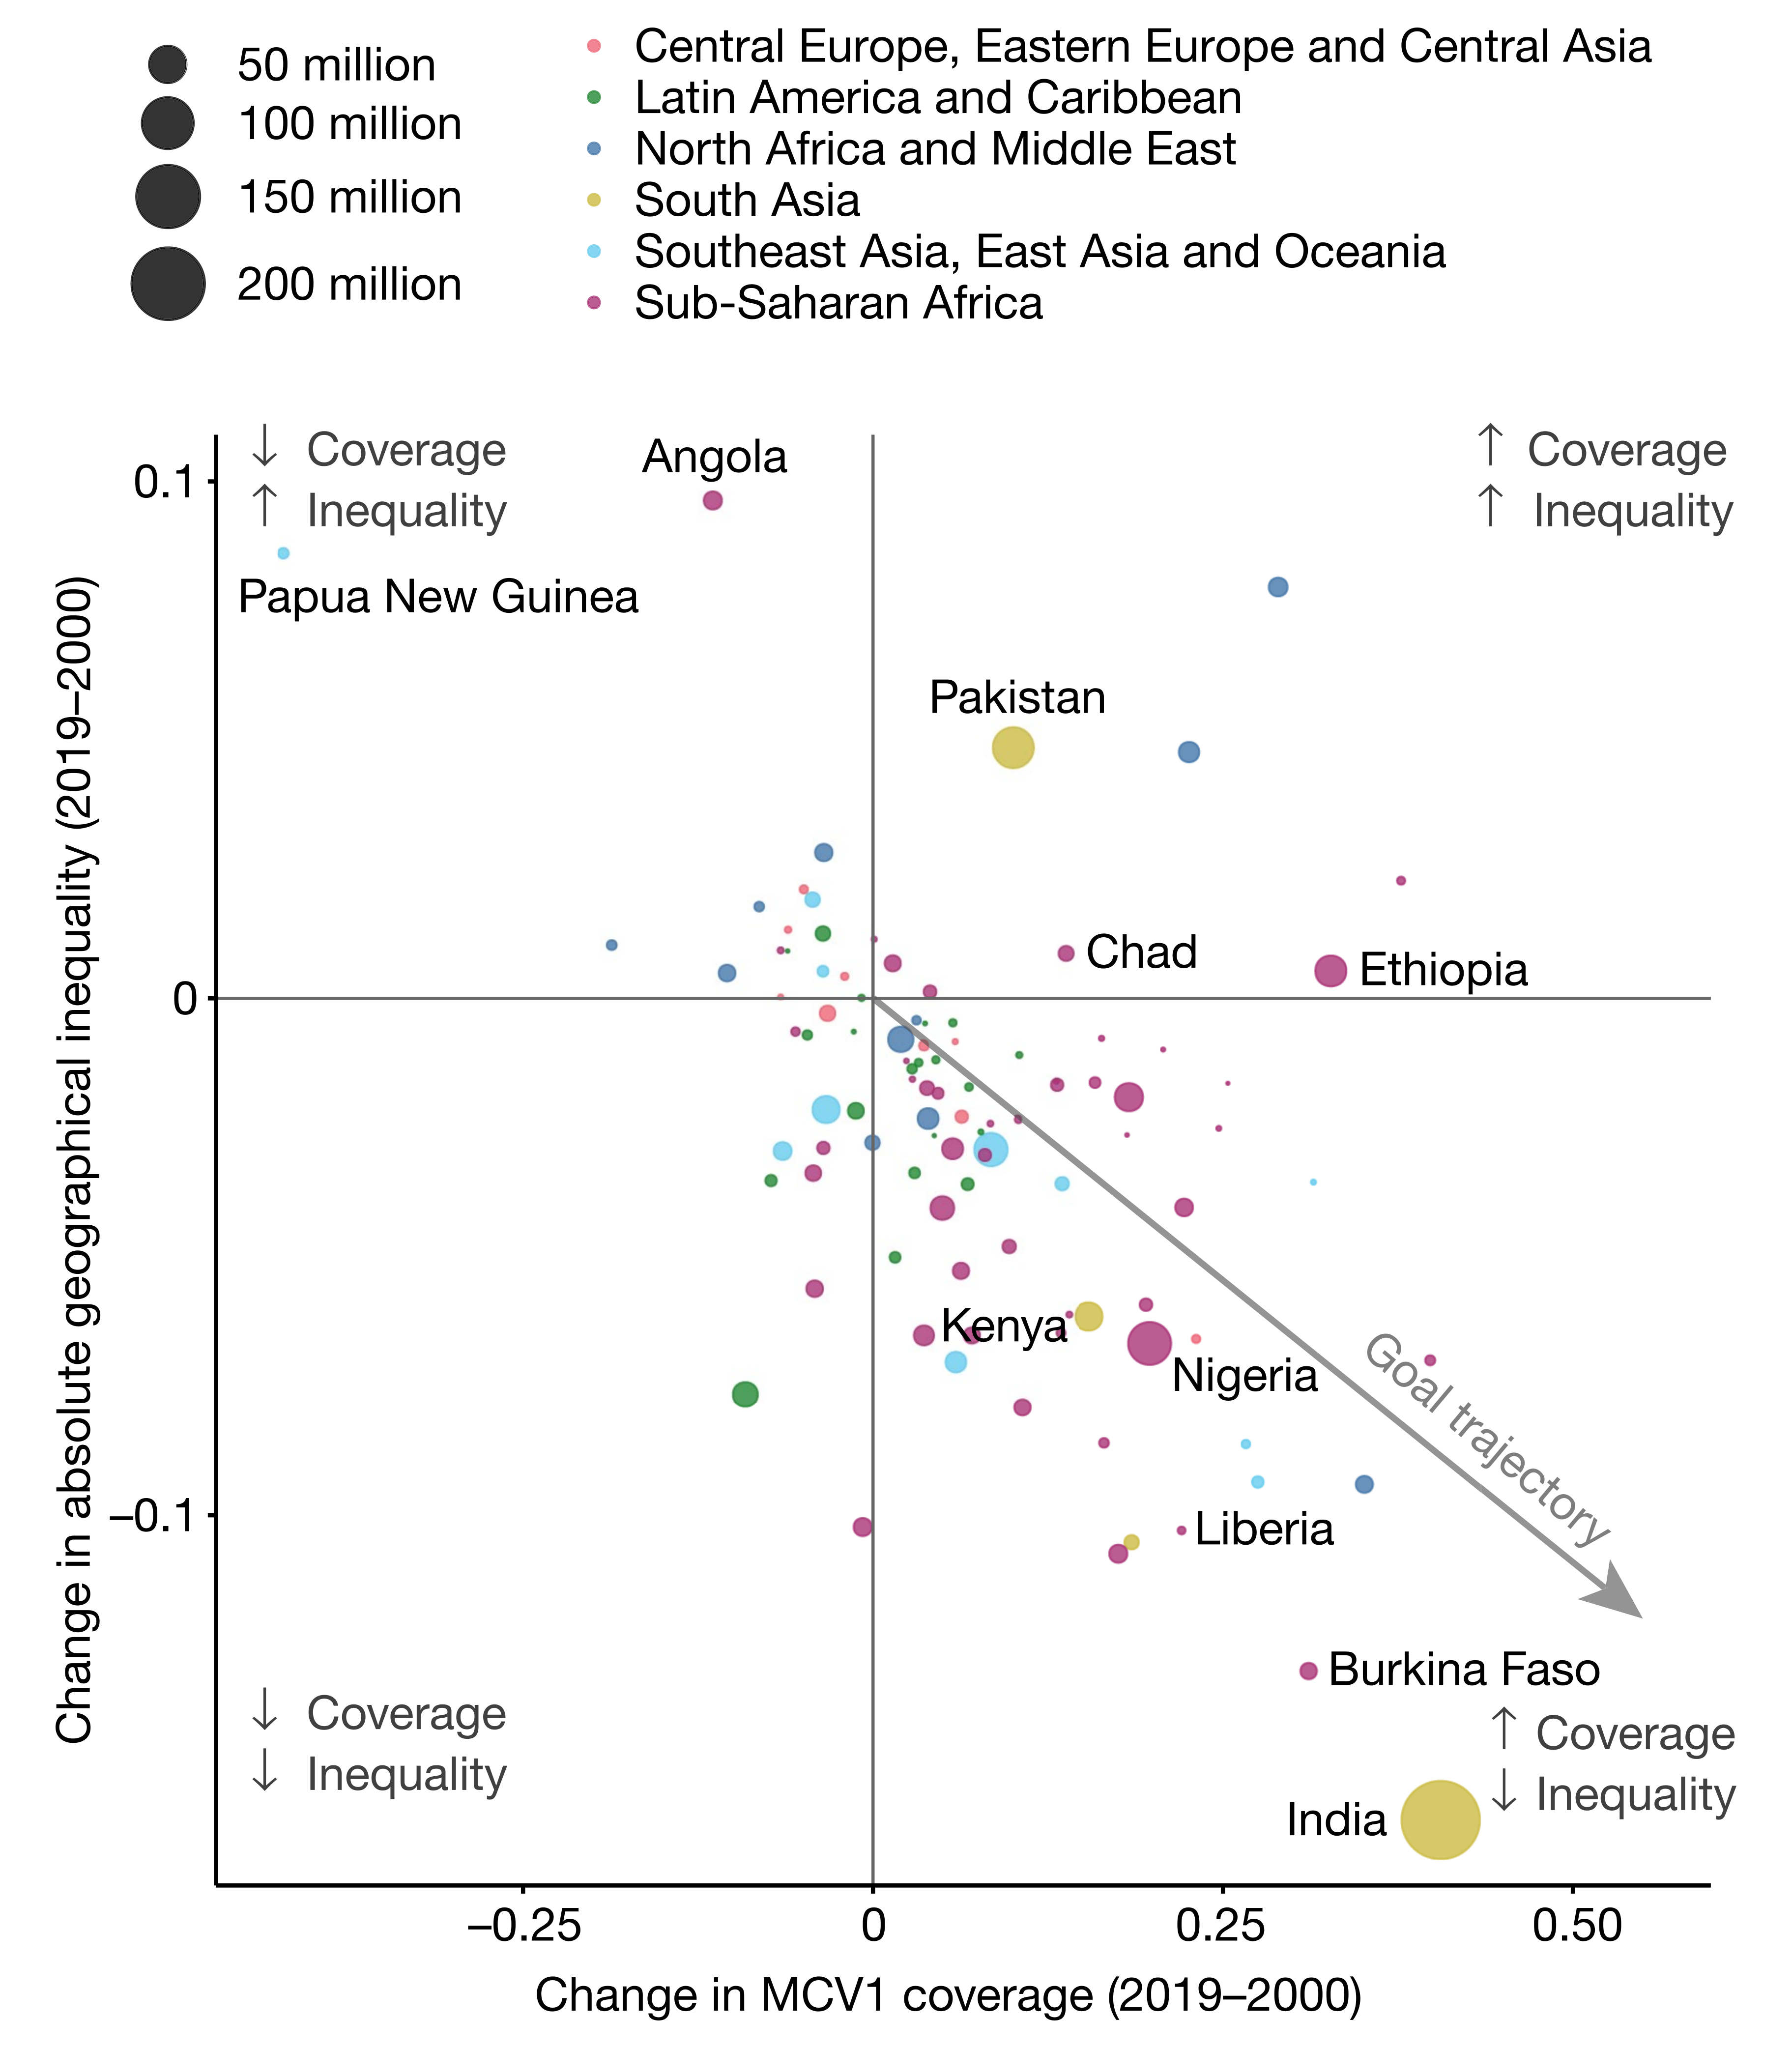
country <- c(
  "Angola",
  "Papua New Guinea",
  "Pakistan",
  "Chad",
  "Ethiopia",
  "Kenya",
  "Nigeria",
  "Liberia",
  "Burkina Faso",
  "India"
)
coverage <- c(-0.14, -0.35, 0.12, 0.14, 0.32, 0.07, 0.2, 0.18, 0.3, 0.35)
inequality <- c(0.1, 0.08, 0.05, 0.01, 0.005, -0.06, -0.07, -0.11, -0.13, -0.16)
df_plot <- data.frame(country, coverage, inequality)Trực quan hóa
Thinh Ong
Biểu đồ 1

Tạo data
Vẽ trục tọa độ
Vẽ các điểm
Hiện tên nước
Vị trí tên nước
Tô màu
Tô màu
Các nước không tên
set.seed(123)
np <- 50
rd <- data.frame(country = rep("", np),
                 coverage = rnorm(n = np, mean = 0.1, sd = 0.12),
                 inequality = rnorm(n = np, mean = -0.05, sd = 0.04),
                 size = rnorm(n = np, mean = 1, sd = 0.4),
                 color = sample(c("red", "green", "darkblue", "yellow", "blue", "purple"), np, replace = T))
df_plot <- rbind(df_plot, rd)
df_plot$color <- factor(df_plot$color)
Vẽ thêm điểm
Kết quả

Biểu đồ 2

Tạo data
region <- c(1:21)

sup_region <- c(
  "green",
  "green",
  "green",
  "green",
  "blue",
  "turquoise",
  "purple",
  "orange",
  "purple",
  "turquoise",
  "red",
  "red",
  "red",
  "orange",
  "turquoise",
  "purple",
  "purple",
  "red",
  "orange",
  "pink",
  "purple"
)

assoc <- c(114.8, 89.0, 86, 79.4, 76.8, 74.0, 72.3, 71.6, 70.7, 68.0, 65.1, 63.2, 63.0, 54.8, 53.3, 52.5, 51.0, 50.6, 43.3, 42.0, 28.0)

assoc_up <- c(145.3, 112.6, 109.8, 101.6, 101.2, 105.6, 93.4, 98.0, 92.3, 100.9, 90.5, 85.4, 83.1, 74.9, 74.3, 73.0, 71.5, 70.9, 66.1, 59.5, 39.9)

assoc_lo <- c(90.4, 70.5, 65.9, 61.7, 57.2, 48.8, 55.1, 51.4, 53.2, 43.2, 45.5, 45.4, 47.1, 38.9, 37.7, 37.0, 35.4, 34.7, 27.4, 28.7, 18.8)

attr <- c(27.3, 21.4, 20.7, 19.4, 21.5, 19.9, 18.6, 17.0, 16.5, 16.6, 16.2, 15.9, 15.2, 14.4, 13.8, 11.7, 12.3, 13.0, 10.5, 11.2, 6.5)

attr_up <- c(35.3, 28.1, 27.7, 25.9, 29.8, 28.5, 24.7, 23.2, 23.1, 25.0, 23.2, 21.9, 20.6, 20.0,  19.5, 16.6, 17.5, 18.5, 16.0, 16.3, 9.4)

attr_lo <- c(20.9, 16.3, 14.9, 14.3, 15.1, 13.1, 13.9, 12.1, 11.6, 10.5, 11.0, 11.1, 11.1, 10.0, 9.5, 8.0, 8.3, 8.8, 6.5, 7.5, 4.3)

df_plot <- data.frame(region, sup_region, assoc, assoc_up, assoc_lo, attr, attr_up, attr_lo)

df_plot <- df_plot |>
  mutate(region = factor(region),
         sup_region = factor(
           sup_region,
           levels = c("turquoise", "purple", "red", "pink", "blue", "orange", "green")
         ))
Vẽ trục tọa độ
Vẽ các cột
Tô màu
Chỉnh màu
Vẽ khoảng tin cậy
Vẽ thêm cột
ggplot(df_plot, aes(x = region)) +
  geom_bar(aes(y = assoc, fill = sup_region, alpha = "a"), stat = "identity") +
  geom_errorbar(aes(ymin = assoc_lo, ymax = assoc_up), width = 0.1) +
  geom_bar(aes(y = attr, alpha = "b"), width = 0.65, stat = "identity") +
  geom_errorbar(aes(ymin = attr_lo, ymax = attr_up), width = 0.1) +
  scale_fill_manual(values = cols)
Chỉnh màu
ggplot(df_plot, aes(x = region)) +
  geom_bar(aes(y = assoc, fill = sup_region, alpha = "a"), stat = "identity") +
  geom_errorbar(aes(ymin = assoc_lo, ymax = assoc_up), width = 0.1) +
  geom_bar(aes(y = attr, alpha = "b"), width = 0.65, stat = "identity") +
  geom_errorbar(aes(ymin = attr_lo, ymax = attr_up), width = 0.1) +
  scale_fill_manual(values = cols) +
  scale_alpha_discrete(range = c(1, 0.8),
                       guide = guide_legend(override.aes = list(fill = c("gray70", "gray20"))))